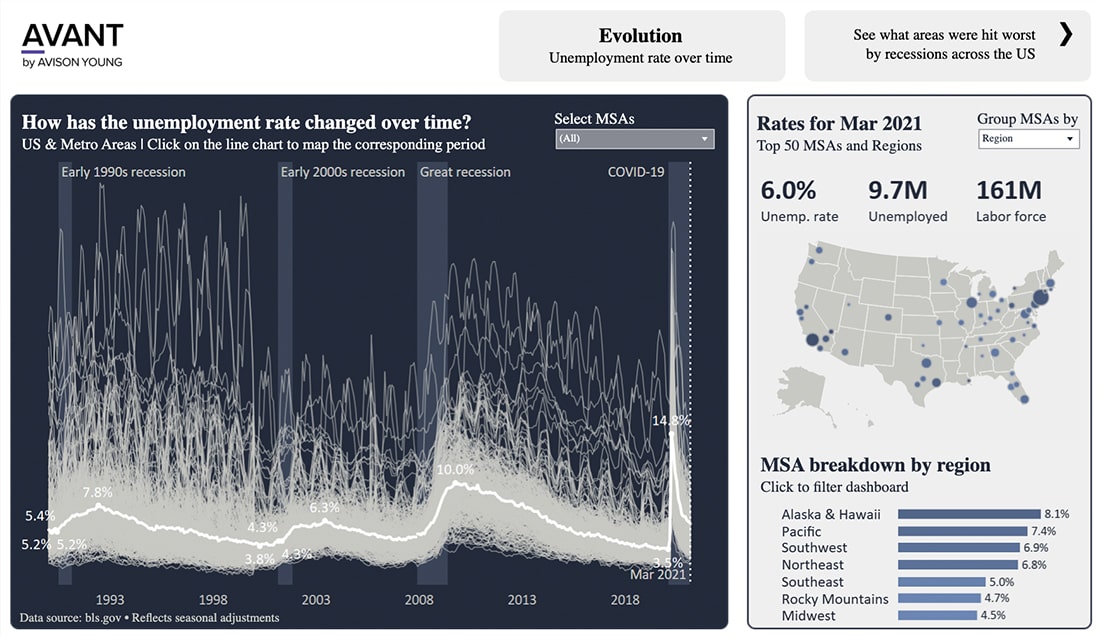
U.S. unemployment data: See the latest unemployment rates alongside historical unemployment data

This dashboard is best viewed in a wider browser window.
Real-time, month-by-month, and year-by-year U.S. unemployment data at your fingertips
Unemployment rates during the COVID-19 pandemic have reached unprecedented heights globally. We’re taking a look at U.S. labor markets that impact location-based decisions – through real-time and historical lenses. For a more comprehensive, like-for-like comparison between economic cycles among various metropolitan statistical areas (MSAs), we’ve adjusted standard Bureau of Labor Statistics (BLS) unemployment data to account for seasonal variances.
Specific industries impacted unemployment rates
The U.S. unemployment rate rose from 3.5% in February 2020 to a peak of 14.8% just two months later as businesses were hindered by declining economic conditions and government regulations aimed at curbing viral spread. To complicate matters, governmental stimuli may have disincentivized some prospective laborers from returning to the workforce as economies reopen and job openings increase.
The result? Regions that are reliant on essential industries such as agriculture and energy have been less acutely affected than regions that are reliant on tourism, retail, and other discretionary industries. MSAs in the Midwest have seen their overall unemployment rate return to just 4.5%, while unemployment on the Pacific Coast and in Alaska/Hawaii remain elevated, at 8.1% and 7.4%, respectively.
See U.S. unemployment data in real time
Our clients make location-based decisions every day and the labor market is a key ingredient. Use these interactive unemployment dashboards that update in real-time every month as the BLS releases new unemployment data across the United States. Investigate how American economies have been affected by and recovered from recessions from 1990 to March 2021, and in the coming months. While the pandemic’s sudden, steep impact and subsequent K-shaped recovery distinguish it from prior recessions, these dynamic analytics should provide instructive historical context.
This dashboard leverages Avison Young’s data-based analytics platform, AVANT. AVANT makes city data more accessible and understandable, allowing clients to make informed, strategic decisions and realize the full potential of their real estate. To discover how your day-to-day with AVANT can improve the value of your real estate, contact one of our Innovation and Insight team members.
