From geo-political events to supply chain issues to commodity scarcity, is there a growing artificial buffer to overbuilding in industrial real estate?

From geo-political events to supply chain issues to commodity scarcity, is there a growing artificial buffer to overbuilding in industrial real estate?

Over the last few years, continued robust leasing activity for modern, highly functional bulk logistics have driven development in the industrial sector to new heights. However, economic and supply chain factors have required both investors and occupiers to navigate increasingly complex headwinds. Demand for new construction is at record levels, and developers are working overtime to manage increasing commodity and materials pricing – with input scarcity exacerbating challenges at the same time. In this issue we delve deeper into the commodities landscape and how this impacts industrial construction going into mid-year.
Best,
Erik Foster
Principal
Head of Industrial Capital Markets
[email protected]
+1 312.273.9486
Construction costs: Where are we headed?
Rising construction costs were a consistent theme throughout 2021. The industry navigated a complex set of economic conditions that adversely impacted materials sourcing. While 2021 saw record price increases for steel, aluminum, lumber and many other construction inputs, there was still room for optimism as some costs moderated at times -- and a surge in demand allowed the market to absorb and pass through many of the added costs.
With inflationary headwinds persisting and sourcing becoming more complicated – and the prospects of additional costs from the Russian invasion of Ukraine – some are wondering where the breaking point is. Many contractors report having to jockey to get supplies before their competitors. Cash has become the common means of exchange and price quotes can expire in less than a week. Will this sustained level of rising costs dampen the pace of deliveries in 2022?
According to an analysis of government research by the Association of General Contractors of America, the cost of non-residential construction materials jumped by more than 21% year-over-year in February 2022. Prices rose by double-digit rates year-over-year for nearly all categories, including steel mill products (74.4%), diesel fuel for transport (57.5%), some aluminum products (37.3%), copper (24.4%), as well as many others. As Russia is a major producer of aluminum and copper, the war is expected to push diesel fuel, copper and aluminum prices higher.
In a fourth quarter 2021 Commodity Report, Linesight, a global construction consultancy firm, notes that these higher costs and delivery delays slowed construction output to $1.63 trillion in 2021, only slightly lower than previous projections of $1.645 trillion. This was likely helped by the passage of the U.S. infrastructure bill, and total construction spending across many sectors is expected to increase 4.5% to $1.701 trillion in 2022. Those figures could be scaled back, however, if rising material prices continue to slow down the construction process.
The Commodity Report also notes that the price of steel is expected to decline slightly, by 0.8% for Q1 2022. Lumber prices, which rose 32% in 2021 as a result of labor disruptions and destructive wildfires in Canada and the U.S., should increase by a marginal 0.7% this quarter. The report findings were based on interviews with more than 160 construction industry experts across the world.
According to Avison Young research from the fourth quarter of 2021, diesel fuel costs increased by 45.2% since October of 2020 and acutely spiked again after Russia’s invasion of Ukraine. Rising diesel fuel prices and trucking wage rates are exacerbating pressures on shipping costs for companies that may have also faced international supply chain disruptions and continued constraints from driver shortages.
Also, the shortage of skilled construction labor continues to plague the industry. Many craftsmen left the industry during the 2008-2009 recession and another surge left during the pandemic. With younger generations lacking interest in pursuing construction trades, there is a significant labor gap, which is adding to development delays and costs.
How’s the pipeline?
There was approximately 500 million square feet of industrial product in the pipeline at the end of 2021 – an impressive number, but not enough new space to satisfy persistent demand. The Inland Empire, for example, closed out 2021 with a 1.5% vacancy rate following a leasing spree that saw activity jump 35.4% over the past two years.
Avison Young Innovation & Insights displayed new deliveries in that market were consistent with prior years, but were not maintaining pace with leasing demand. There were 77 properties completed throughout 2021, totaling 17.4 million square feet. Between build-to-suit development, pre-leasing or post-spec leasing activity, these properties have already achieved an occupancy rate of 87.2%. Also, there was 87 million square feet of industrial space proposed and under construction at year-end.
Supply of industrial space across the U.S. has continued to trail demand this year. As of early March, average vacancy rate has fallen to 4.4% from 5.8% a year ago. The impact on occupiers has been significant, given the importance of distribution and warehouse space for tenants trying to transport goods to suppliers, manufacturers, clients or stores as well as directly to consumers. Rents are being pushed up by a supply-demand imbalance, and now equilibrium is being thrown off again by construction material pricing and scarcity.
There are no easy answers to these construction commodities issues, but the industrial sector has shown considerable resiliency over the last two years and will continue to push through and look for creative solutions – especially as demand is not expected to relent in the near-term. Stay tuned as our team continues to monitor these issues and their impact on the industrial sector.
Sources: Association of General Contractors of America, Avison Young Innovation & Insights, Construction Dive, GlobeSt, Linesight
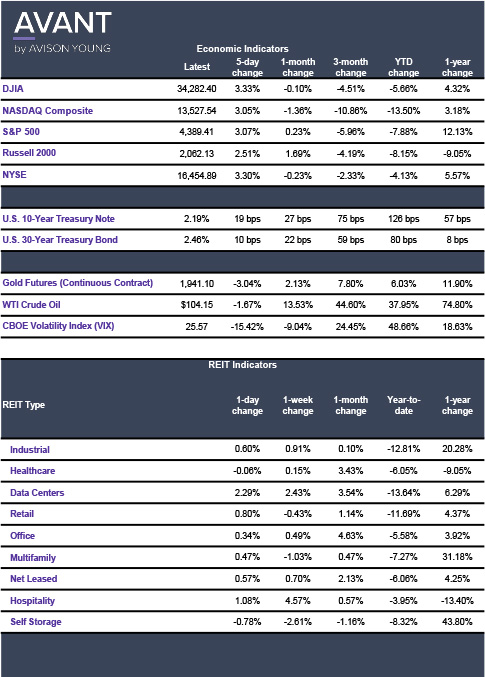
Click the image for Economic Indicators.


